Key Takeaways
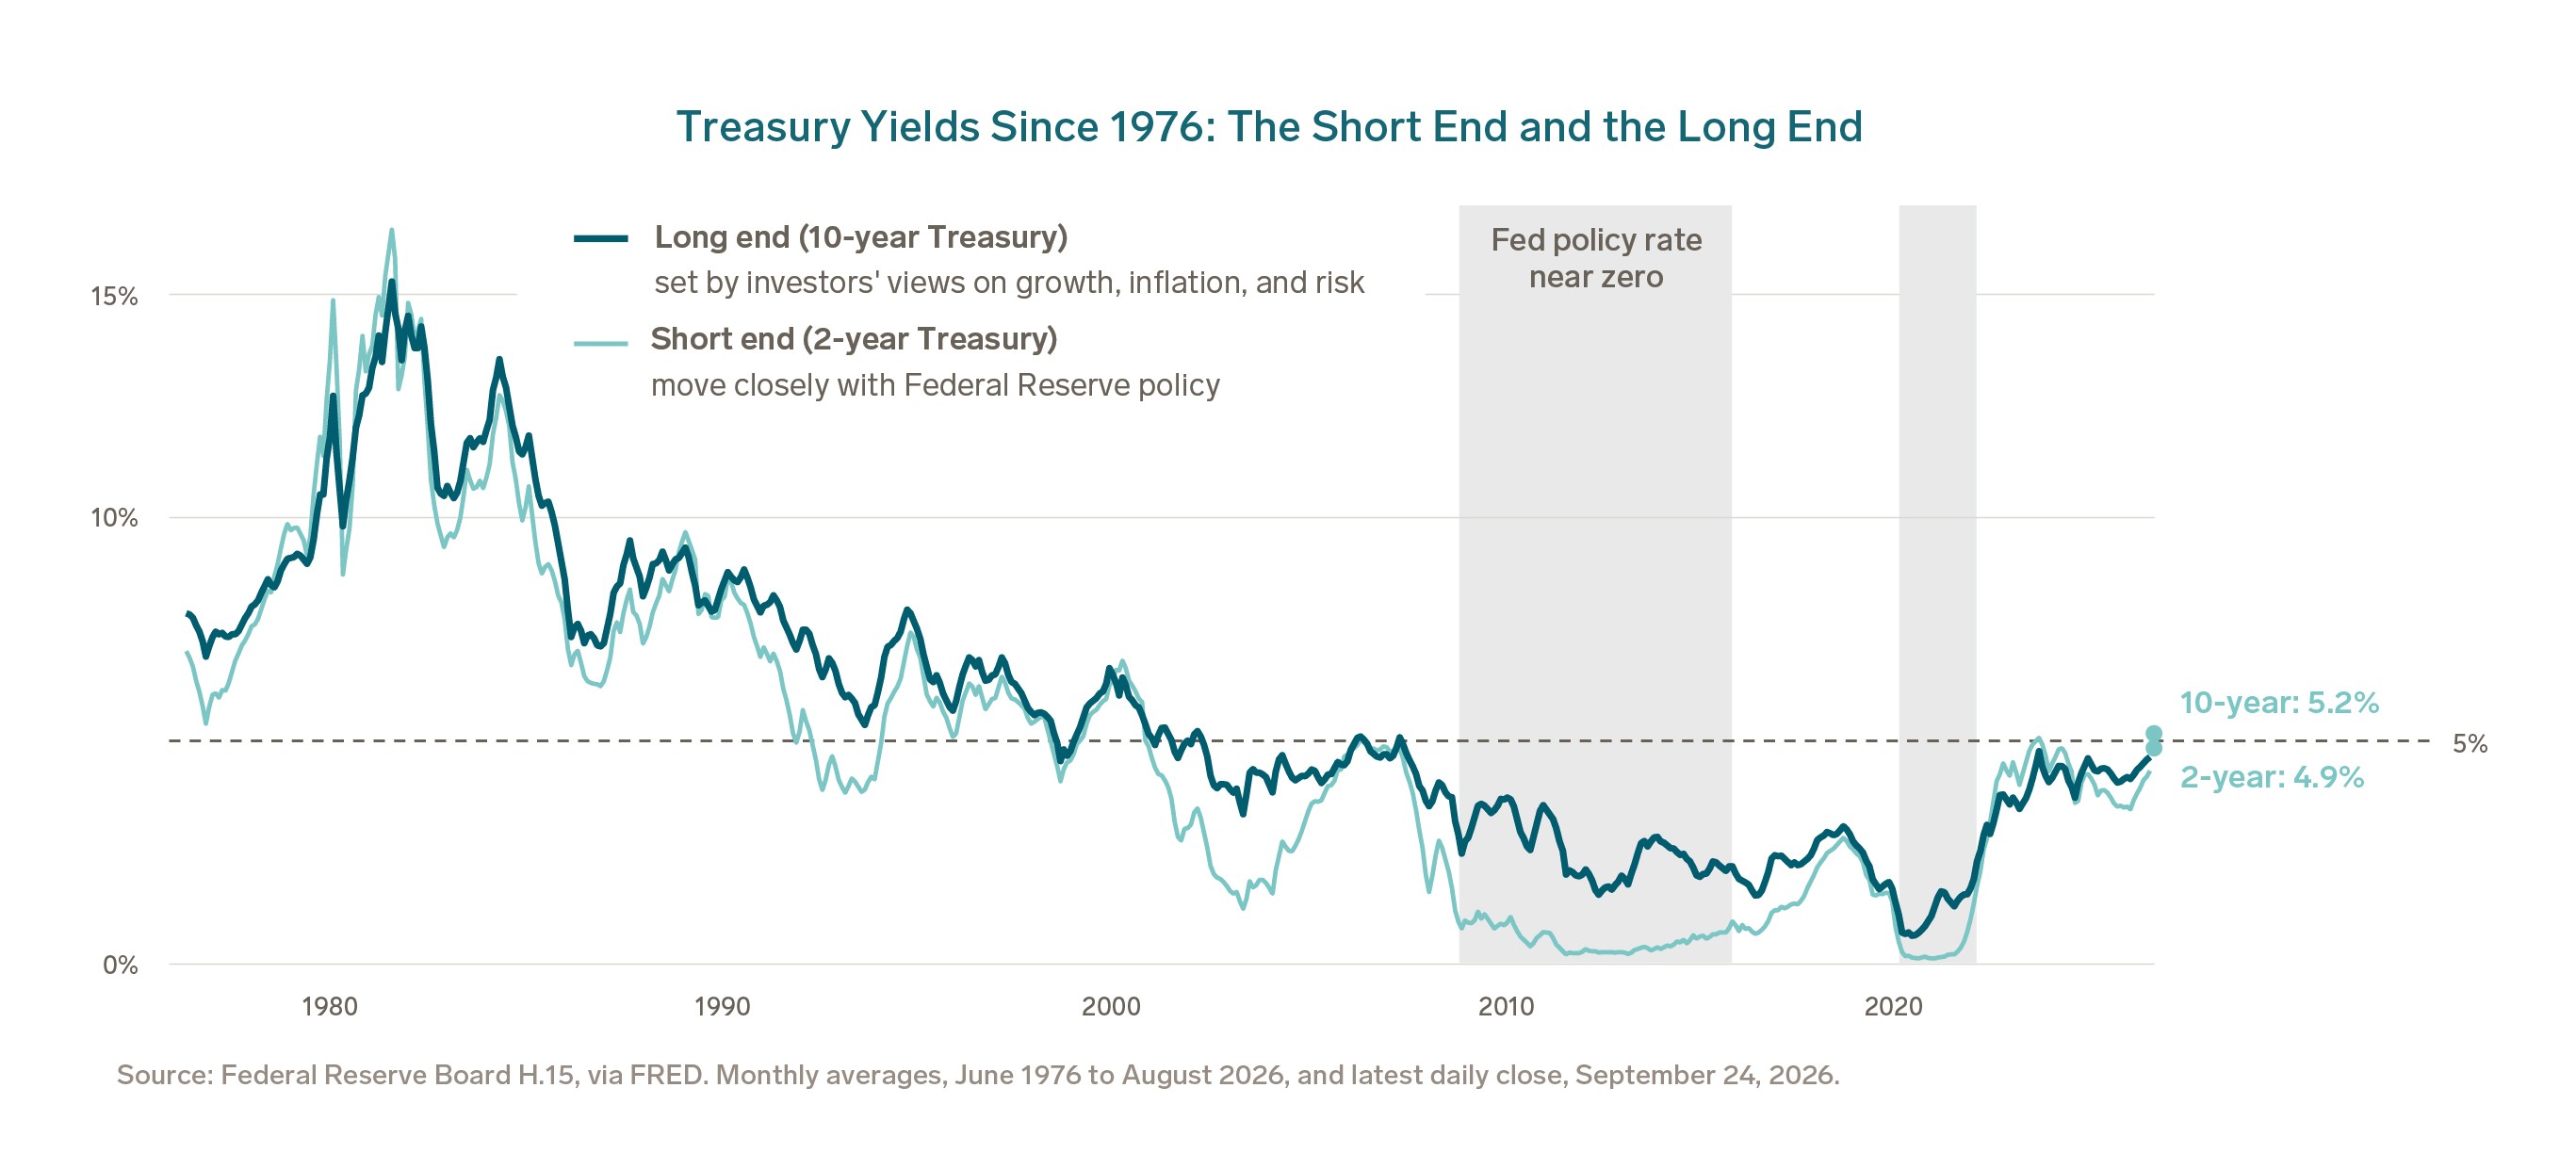
- The 10-year Treasury closed above 5% at the end of September, a level it last held for a full month in 2007. Measured against the past 60 years, that is closer to normal than high.
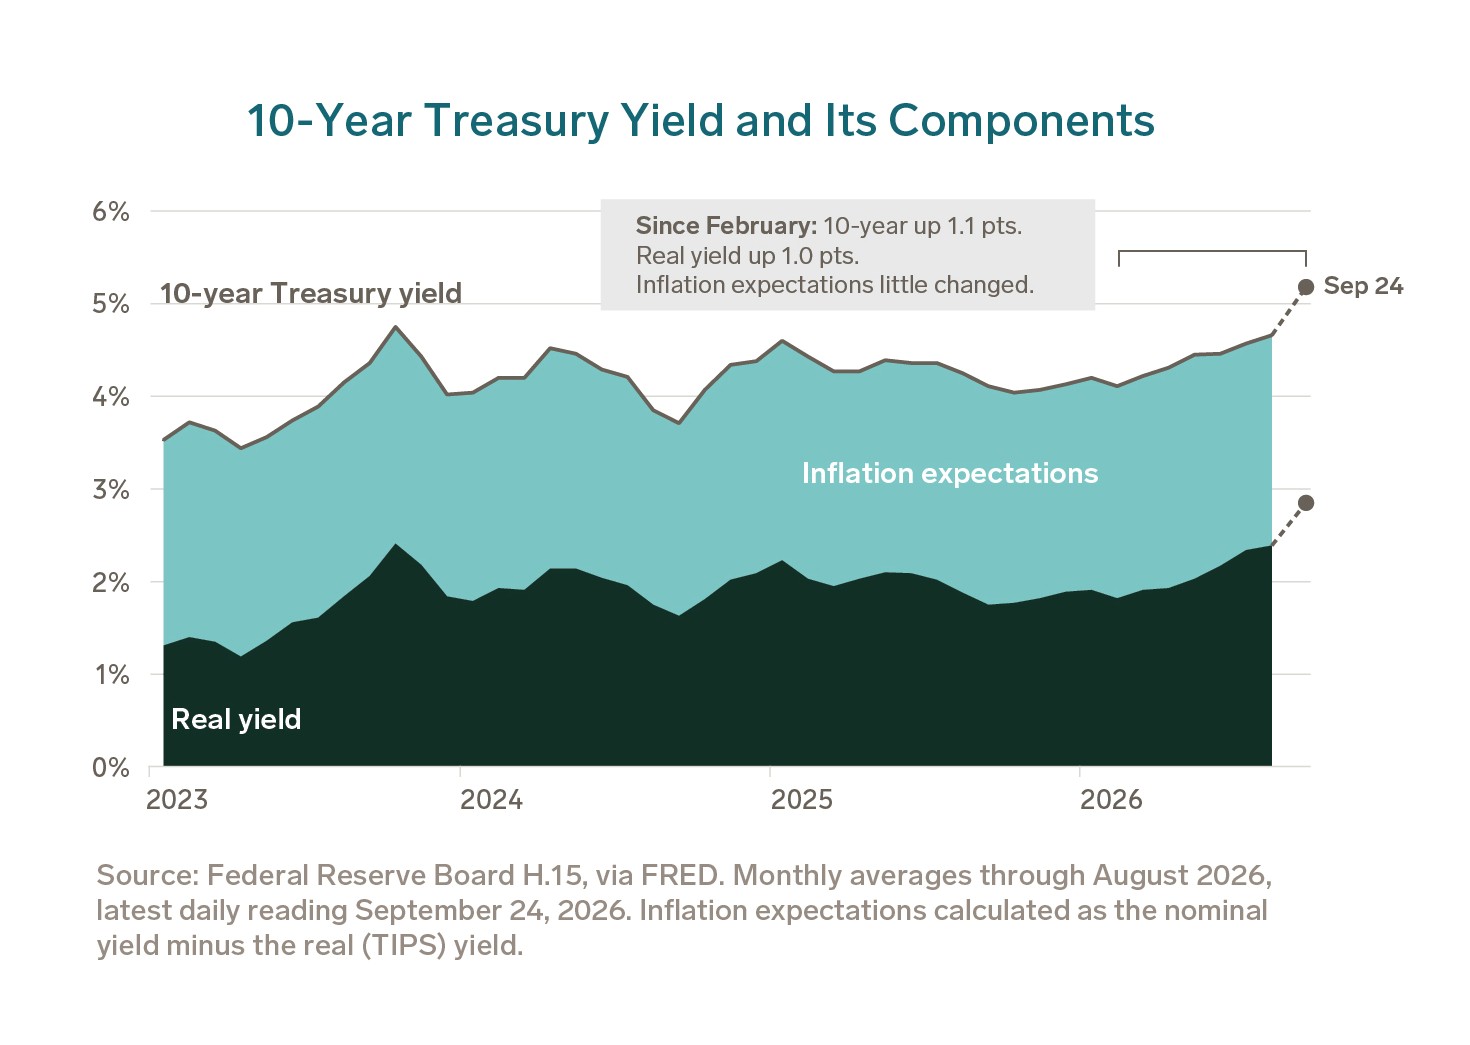
- Nearly all of the rise since February came from real yields, not inflation fears. That points to strong demand for capital, a sign of economic health.
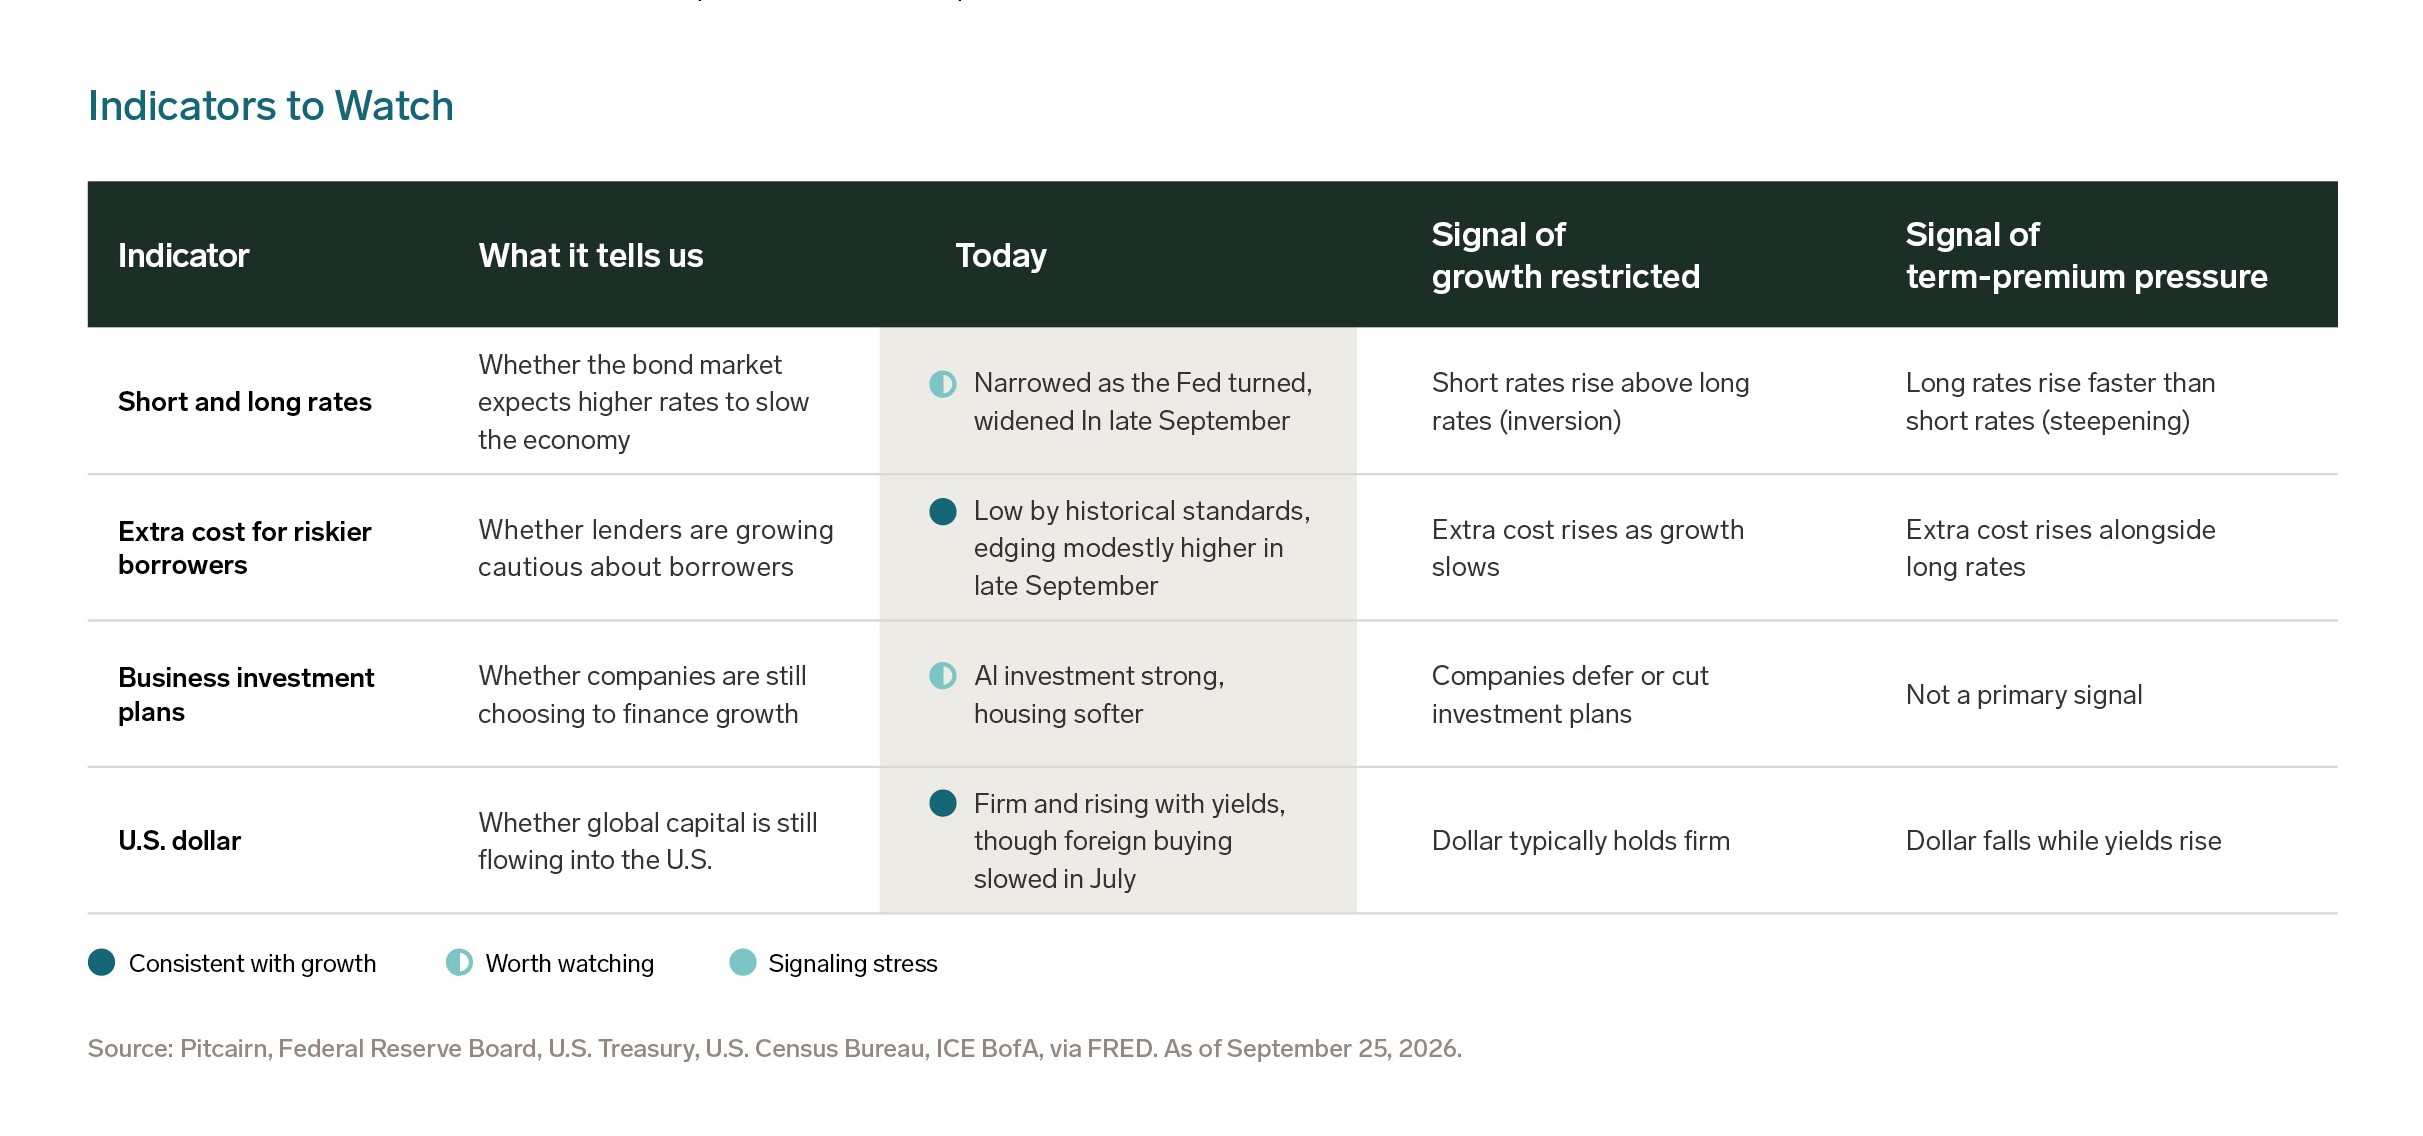
- Two of the four indicators we watch support that reading. The fourth, the gap between long and short rates, is where we would expect trouble to show up first.
- In our view, the current portfolio mix still fits. A sustained 5% would shift more of its return toward income, a shift we believe the mix can absorb.
5% is High for the Last 15 Years, Not the Last 60
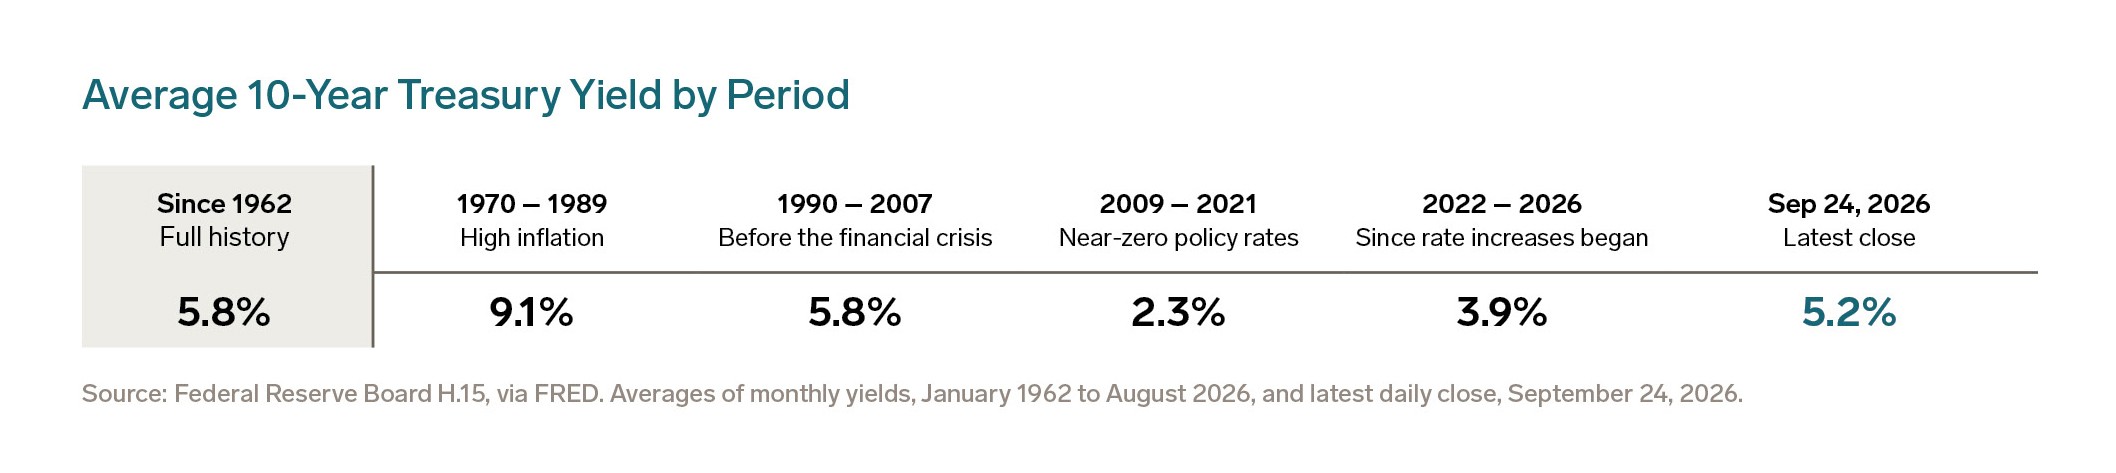
On September 24, the 10-year Treasury yield closed at 5.2%. It last averaged above 5% for a full month in July 2007.
Round numbers carry weight in markets, and for many investors 5% has long marked the line between normal rates and high ones. Crossing it raises the question of what comes next.
For most of the past fifteen years, a 10-year Treasury yield near 5% would have seemed out of reach. Near-zero policy rates, central bank bond buying, and a global surplus of savings pushed yields to historic lows and held them there.
By longer historical standards, though, 5% is not especially high. Since the 1960s, the 10-year has averaged close to
6%, so 5% is less a peak than a return toward normal after an unusual decade.
Rates Are the Price of Capital
For portfolio positioning, the milestone matters less than what a sustained 5% would mean for a multi-asset portfolio.
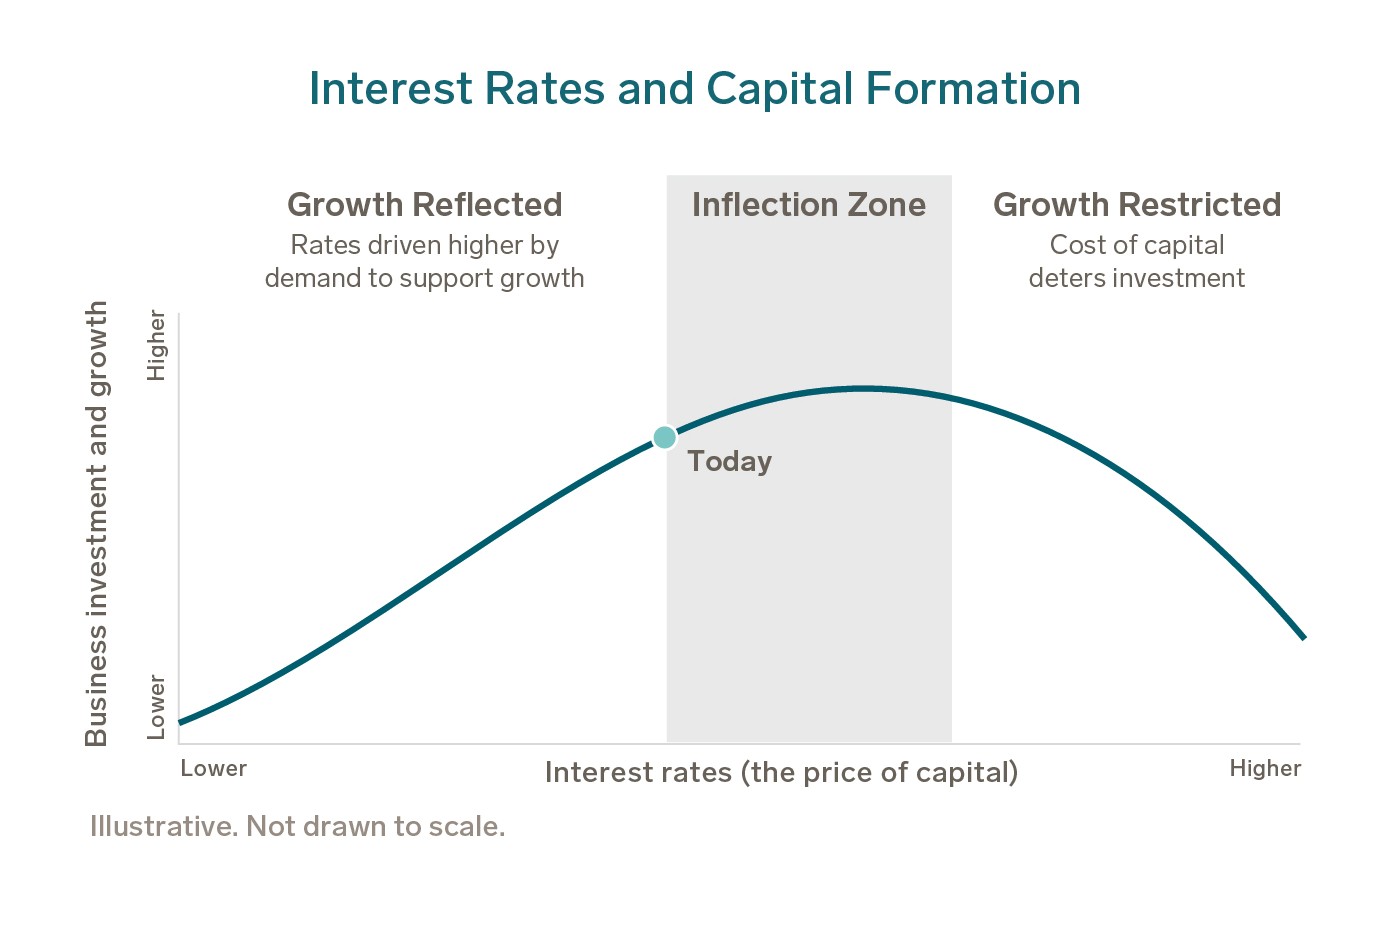
It helps to think of interest rates as the price of capital.

Like any price, the cost of borrowing rises when demand is strong. Up to a point, higher yields are a good sign: businesses want to borrow to build, hire, and invest. Rates are reflecting growth.
Past that point, borrowing becomes too expensive. Companies put projects on hold, and earnings follow. Rates are restricting growth.
The question for investors is not whether 5% is high. It is which side of that line we are on.
Real Yields, Not Inflation Fears, Are Doing the Lifting
Since February, the 10-year yield has climbed from a 4.1% monthly average to 5.2%. Nearly all of that 1.1-point rise came from real yields. Inflation expectations have barely moved, holding between 2.1% and 2.4% since the start of 2023.
That matters because a yield has three parts, and each tells a different story:
1. Real yield: the return after inflation. It tends to rise when demand for capital and expectations for growth are strong.
2. Inflation expectations: the extra return investors require to offset the loss of purchasing power from rising prices.
3. Term premium: the extra return investors require to commit money for ten years rather than lend repeatedly over shorter periods. It tends to rise with heavy government borrowing or policy uncertainty. It cannot be measured directly, and part of it can sit inside the real yield.
A rise led by real yields usually signals strong demand for capital rather than inflation fears. It is not proof, though. Because part of the term premium can sit inside the real yield, yields alone cannot settle the question.
The next section looks at what helps tell the two apart.
Two of Four Indicators Point to Growth
No single market yield can tell us whether rates have moved from reflecting growth to restricting it.
Instead, the answer shows up in how markets and businesses behave. We watch four indicators, shown below, for signs that rates are moving away from growth reflected and toward one of two less healthy outcomes:
- Growth restricted: borrowing becomes expensive enough that lenders pull back and companies defer investment, which pressures earnings. Short rates rising above long rates is often the first sign.
- Term-premium pressure: long rates rise on fiscal or inflation worries while the dollar weakens, which pressures the value of long-dated assets, bonds included. The curve chart earlier in this piece does not capture this risk.
Today, two of the four indicators are consistent with growth reflected. The one to watch is the gap between long and short rates.
When long rates rise faster than short rates, the yield curve steepens. That steepening leans toward term-premium pressure. With inflation expectations flat and the dollar firm, the full pattern is not in place. Still, this gap is where we would expect change to appear first.
Fiscal Risk: Worth Watching, Not Yet Showing
Clients often ask whether rising yields reflect Washington’s borrowing. The concern is reasonable: the federal deficit runs near 5.6% of GDP,1 and government borrowing competes with companies for the same pool of savings, which can raise the price of capital for everyone.
So far, the evidence points the other way. U.S. businesses and households still save more than they invest, a surplus of roughly 2.7% of GDP,1 which leaves room to absorb government borrowing without squeezing private projects.
The clearest sign of fiscal stress would be a weaker dollar alongside rising rates, as global investors demanded more to hold U.S. debt. Today the dollar remains firm and foreign investors continue to buy U.S. bonds and stocks. We treat fiscal risk as something to monitor, not a concern to dismiss.
What It Means for the Portfolio
For a portfolio already in place, the key question is whether the current mix still makes sense. In our view, it does, because its parts respond to different drivers.
The 10-year Treasury is the starting point. Because investors treat it as risk-free, its yield is the hurdle every other asset in a portfolio has to clear. When that hurdle rises, the extra return for owning everything else narrows.
We set long-term return expectations using a 4.25% baseline for the risk-free rate, so our strategic allocation does not swing with each quarter’s move in yields. We review that baseline each year, and a sustained move above 5% would prompt us to revisit it.
Because each asset class’s expected return builds on that baseline, raising it would lift the starting point for the whole portfolio, not just bonds. What would change most is how the portfolio earns its return, and that depends on what is driving rates higher.
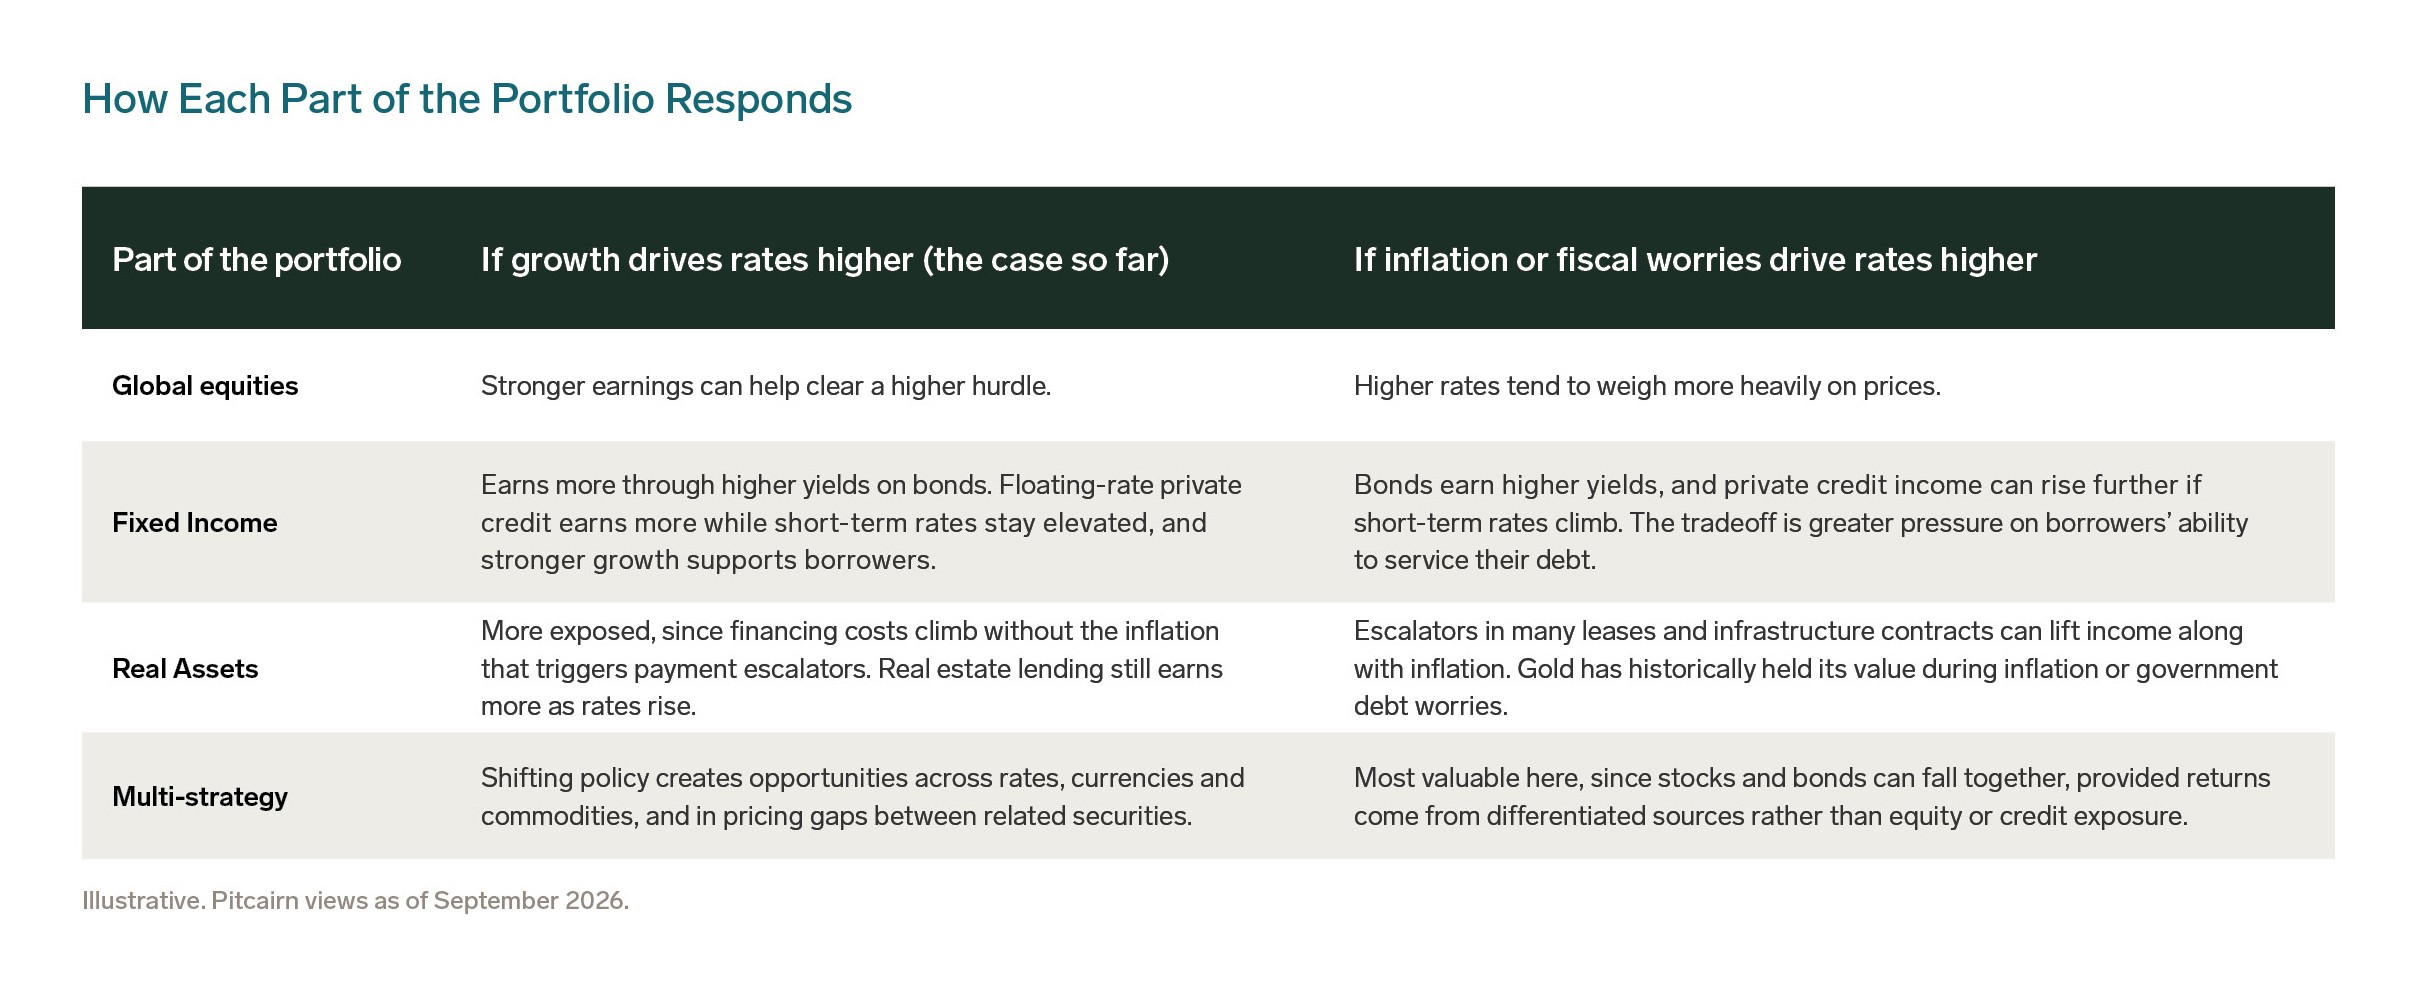
Together, these parts balance one another. Equities tend to do best when growth lifts rates, real assets when inflation does, and fixed income and multi-strategy earn more in either case. A sustained 5% would shift more of the portfolio’s return toward the income it earns, a shift we believe the mix can absorb.
Bottom Line
A 10-year yield above 5% calls for discipline, not alarm. In our view, the rise so far reflects strong demand for capital, and the indicators we watch largely support that reading.